Data Interpretation – Trend Analysis vs. Fixed Limits
Data Interpretation – Trend Analysis
By Timothy Gibbons – Senior Data Analysis
Fixed limits, trend analysis or a combination of the two can be used in Interpreting oil analysis results. Fixed limits are typically determined by guidelines from the laboratory, the equipment manufacturer or from the sampling customer.
Physical properties of the lubricant will typically be evaluated according to fixed guideline limits. These properties include Viscosity, Acid Number, Base Number, Water Content, Fuel Dilution, Particle Count, etc. Test results outside of a defined set of guidelines may warrant some type of corrective action. But a change in trend, even if still within guidelines, may lead to increased scrutiny and/or increased sampling frequency.
Wear metals are more typically assessed based on trend analysis. How the wear levels change over time can give more insight into equipment condition than can be obtained by comparing to a fixed set of limits. Applying a fixed set of guidelines to wear metals can lead to false warnings for minor changes in wear. It may also skip over significant increases in wear, without bringing the increase to the customer’s attention. To see how this is possible, we will look at a couple of data sets and compare how the results would be evaluated by a fixed set of guidelines versus trend analysis.
As an example, we will examine the Iron concentration over a six-month period for two gearboxes, samples on a regular monthly interval. Both gearboxes show a stable wear trend over the first five months. At the last sample interval, the results yield very different results for trend vs a fixed 100 ppm Iron limit.
Example A

At the June sample, Iron exceeds the fixed guideline of 100 ppm and triggers an abnormal report. This could lead to the customer taking corrective actions when the actual increase in wear is only about 7 % over the average of the previous 5 samples. By trend analysis, the increase is minor, and no action would be called for.
Example B
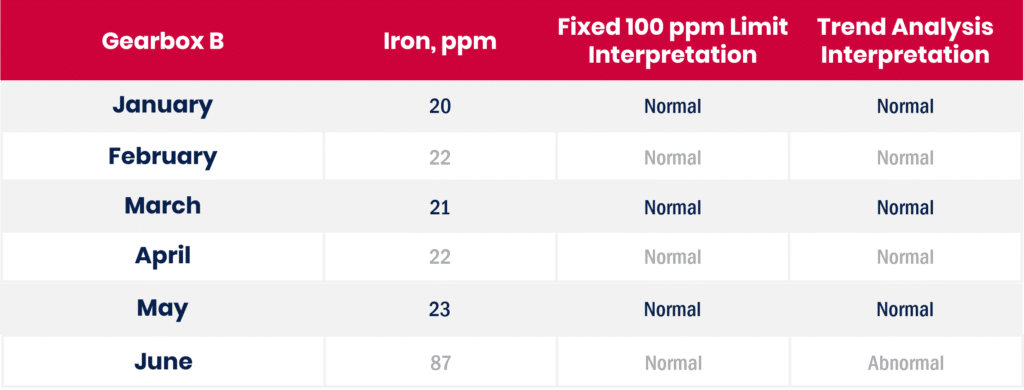
In this example, using a fixed limit of 100 ppm for Iron yields normal reports for all samples. However, the June sample shows about four times the wear level of the prior samples, indicating a significant change in wear pattern. The trend analysis interpretation correctly flags this result as abnormal giving the customer warning that something has changed, and further investigation and possible corrective action is needed.
In both examples, applying a fixed wear metal guideline is not as useful as trend analysis in giving the customer a clear picture of what is happening with their equipment. Trend analysis provides a better means of assigning sample severity with fewer false positives and fewer false negatives. This allows the customer to direct their maintenance efforts and expenses to the equipment most in need, reducing costs and increasing equipment availability.
Authored by Timothy Gibbons, Senior Data Analyst
